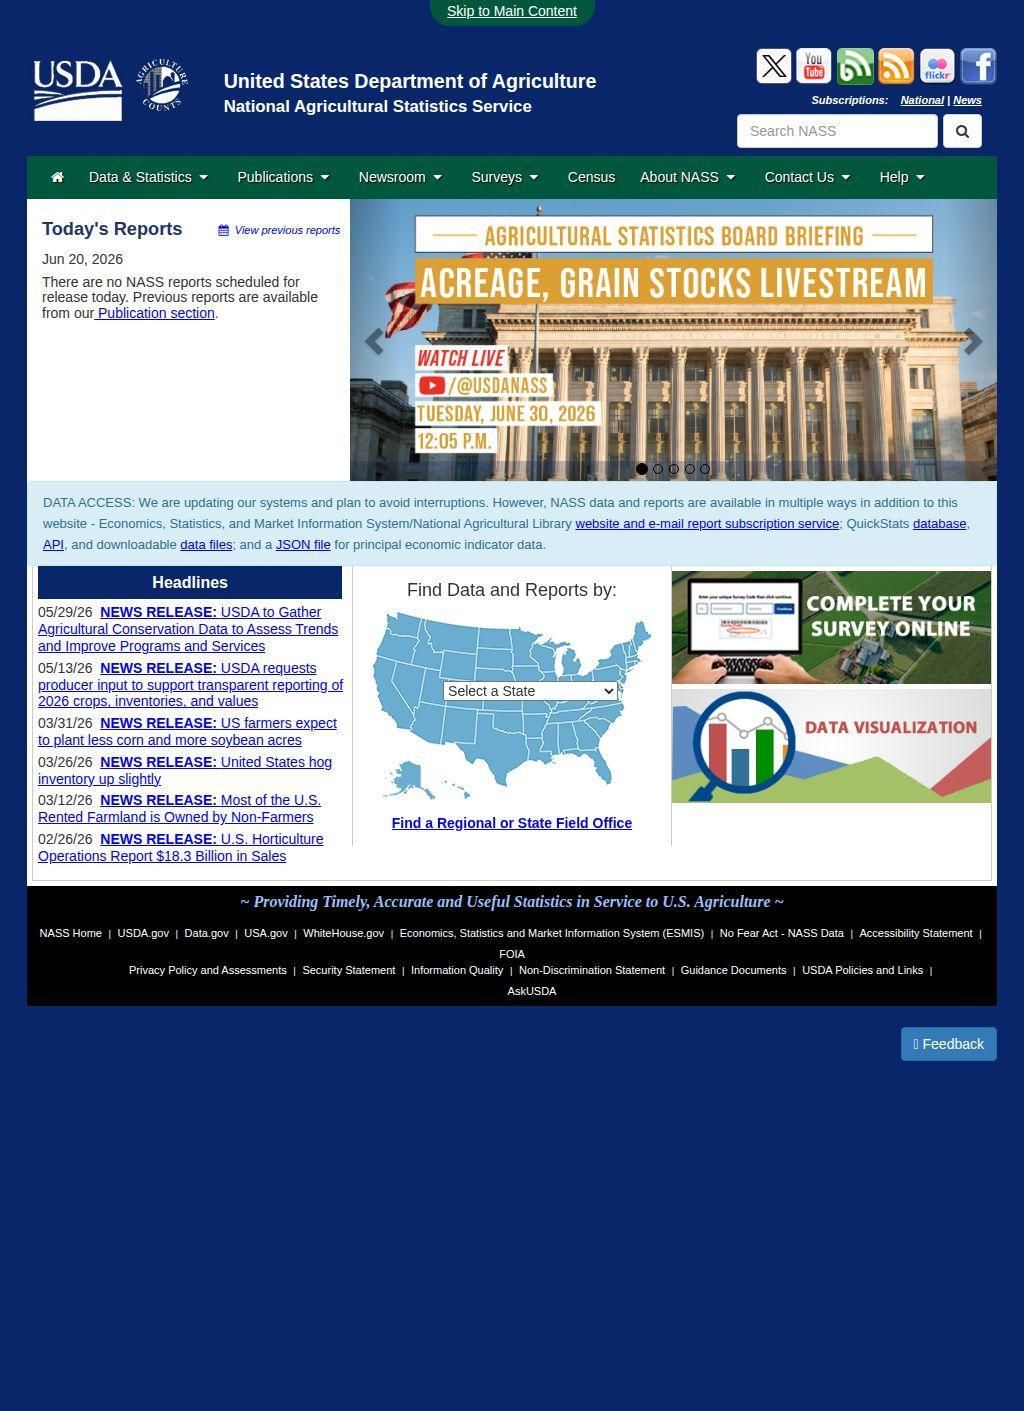
You are trying to settle an argument about corn acreage in a particular state, or you need to know what hogs were selling for in a given quarter, or you are a graduate student who needs county-level cattle inventory numbers that will survive peer review. Most web searches dead-end at a trade-press summary that paraphrases a number without saying where it came from. The USDA National Agricultural Statistics Service is the place that number originally came from, and going to the source removes a layer of guesswork that trips up a lot of agricultural research.
Quick Stats database for commodity queries
The workhorse of the USDA National Agricultural Statistics Service is Quick Stats, a searchable database that lets you pull figures by commodity, geography, and time period. It is the kind of query tool that rewards a few minutes of learning its filters: pick a crop, narrow to a state or county, set a year range, and the data comes back ready to read or download. There is also a Quick Stats Lite version for people who want a simpler path to common pulls without building a full query.
APIs and JSON feeds for developers
For developers and quantitative researchers, the USDA National Agricultural Statistics Service exposes APIs and JSON feeds, so the same data that powers the web interface can be pulled straight into a script or a model. That is important if you are running anything that needs to refresh on a schedule, because you are not stuck copying tables out of a PDF by hand.
Reports on production, livestock, prices
Beyond the database, the agency runs a heavy publishing calendar. Recurring reports from the USDA National Agricultural Statistics Service cover crop production, grain stocks, livestock inventories, and prices received by farmers, and these are the releases that commodity traders and analysts watch closely because they move markets. The reports follow a known cadence, which is part of their credibility: the methodology stays consistent from one release to the next, so the year-over-year comparisons mean something. Sitting above all of it is the Census of Agriculture, conducted every five years, which is the most complete accounting of U.S. farms and ranches anyone produces. If you want to understand structural change in American agriculture, farm size, operator demographics, land use shifts, the census is where that picture is drawn in full detail.
Cropland Data Layer and geospatial mapping
The geospatial side is where the USDA National Agricultural Statistics Service goes past plain tables into something a lot of people do not expect from a statistics agency. The Cropland Data Layer is a satellite-derived annual map of land cover, classifying what was actually growing where down to a fine resolution, and it has become a staple input for academic and commercial models alike.
CroplandCROS lets you cross-reference that data interactively, and VegScape maps vegetation condition, which is useful for tracking drought stress or comparing a current season against a normal one. These are genuinely substantial tools, the sort a private vendor would package and sell. I have seen the Cropland Data Layer turn up as a base layer in watershed studies and insurance modeling alike, which says something about how much trust practitioners put in the USDA National Agricultural Statistics Service output.
Specialized surveys for organic production
Specialized surveys round out the coverage in directions the headline reports skip. The USDA National Agricultural Statistics Service publishes dedicated data on organic production, local food marketing, and aquaculture, sectors that are smaller in dollar terms but matter a great deal to the people working in them and to policymakers tracking where food systems are heading. The site also keeps an archive of historical statistical bulletins going back decades, along with news releases and executive briefings, so the time series do not start the day you happen to visit. For longitudinal work, that depth of back data is often the deciding factor in whether a question can be answered at all.
State field offices conduct survey work
One feature of the USDA National Agricultural Statistics Service that is easy to overlook is its physical reach. The agency runs state and regional field offices spread across all fifty states, and those offices do the actual survey work that feeds the national totals. That structure is why the localized data has teeth: the numbers for a specific state are gathered closer to the ground, not estimated from a desk in Washington. The underlying figures come from farmers and ranchers responding to voluntary surveys, and the whole apparatus rests on that participation. When you read a figure from here it represents real reported answers aggregated and processed, with the methodology documented.
The USDA National Agricultural Statistics Service serves an unusually wide range of people, which explains the range of its tools. A row-crop producer checking prices, an academic building a dataset, a government analyst writing policy, and a commodity trader reading the next stocks report all draw on the same repository. The site separates quick-answer paths from deep-query and developer paths reasonably well. A casual visitor can land on a report summary and leave satisfied; a heavy user can drop into Quick Stats or the API and stay for hours.
Learning curve and interface complexity
The honest limitation of the USDA National Agricultural Statistics Service is the learning curve. The data is authoritative and the coverage is wide, but the interface assumes you already know roughly what you are looking for. Quick Stats has a lot of filters, and someone who does not know the difference between a commodity, a data item, and a domain category can feel lost on the first try.
The reports are written for an audience that understands agricultural reporting conventions, so a newcomer may need to read a methodology note or two before the numbers click. None of that undercuts the quality of what is here. It just means the USDA National Agricultural Statistics Service is built more for the working analyst than for the idle browser, and that is a defensible choice for a federal statistical agency whose job is precision over polish.
What you get in exchange for climbing that curve is data you can stand behind. When a figure is sourced to the USDA National Agricultural Statistics Service, downstream readers tend to accept it without further argument, and that credibility is the whole point. The numbers are collected under a consistent methodology, published on a predictable schedule, and archived so they can be re-checked years later. For research that has to survive review, or for a business decision that has to survive a second look, that traceability is what the USDA National Agricultural Statistics Service does better than almost any comparable source.
Weighed against a commercial agricultural-data vendor such as Gro Intelligence, the trade-off is clear enough. A paid platform will hand you a slicker dashboard, push notifications, and analyst-built forecasts layered on top of the raw figures, and for a trading desk that convenience can pay for itself. What it cannot give you is the primary source, because vendors like that are themselves built on top of the USDA National Agricultural Statistics Service feeds. If you want polished interpretation with a subscription invoice attached, look there. If you want ground-truth data with documented methods, no paywall, and the authority that comes from being the agency of record, the USDA National Agricultural Statistics Service is where serious work starts and, most of the time, where it should.
Business address
USDA National Agricultural Statistics Service
1400 Independence Avenue SW,
Washington,
DC
20250
United States
Contact details
Phone: 800-727-9540