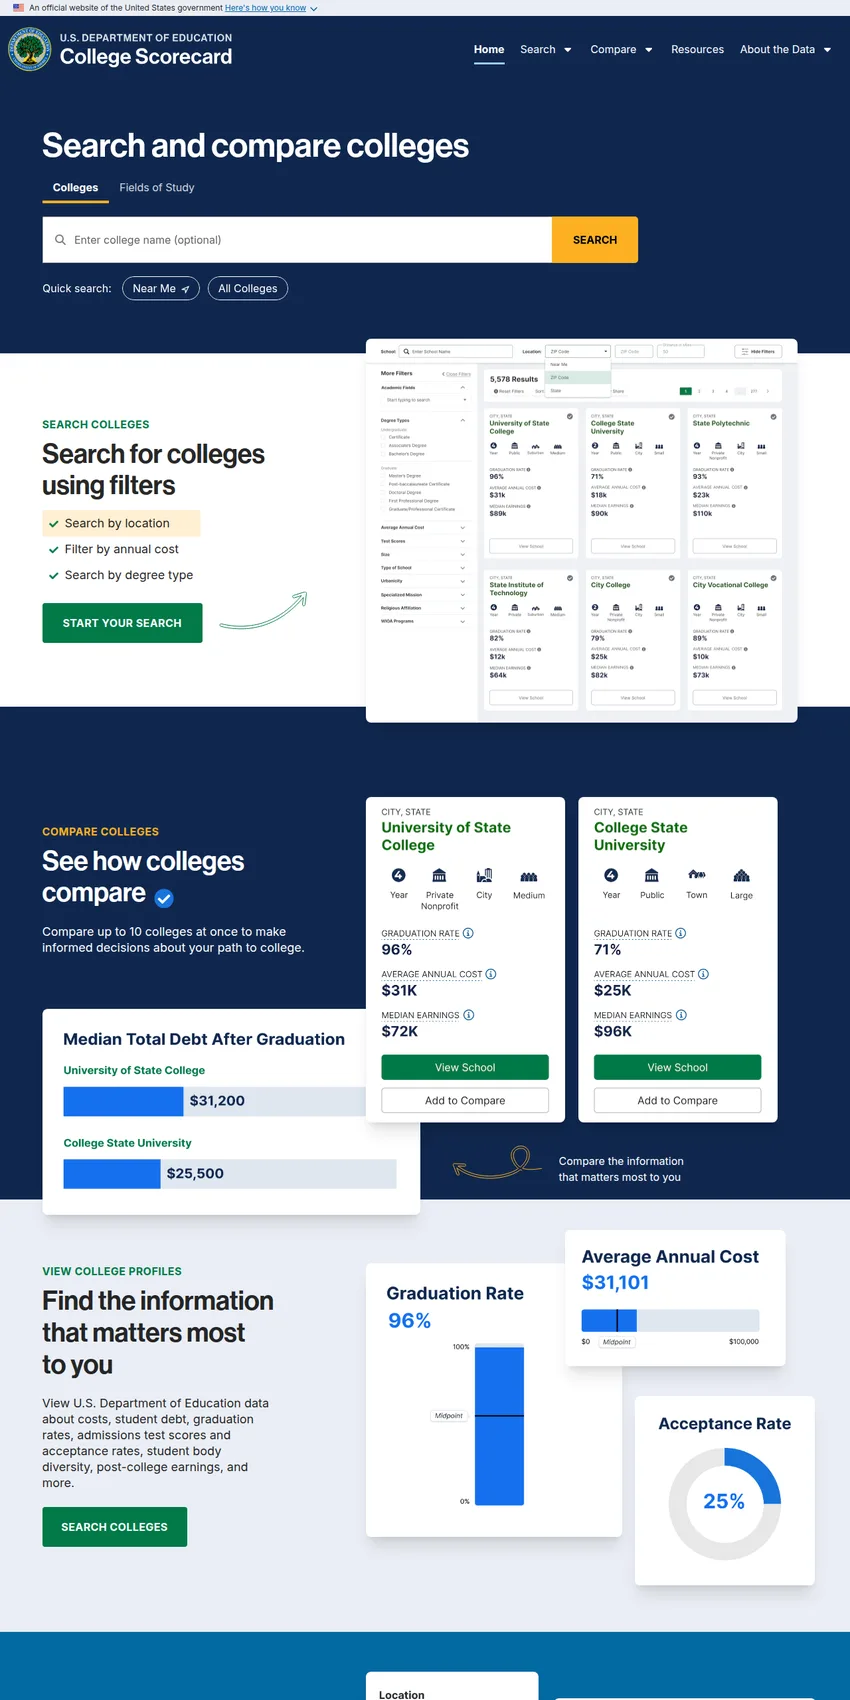
Reading a college by its numbers
Sticker price tells you almost nothing about what a college will cost a given family or what its graduates go on to earn. College Scorecard was built to close that gap. It is a public data tool run by the U.S. Department of Education, and it puts the same set of outcome measures next to every school so that a state university, a small private college, and a two-year technical program can be compared on the same terms.
The design idea is simple. Instead of asking families to trust marketing, hand them federal data that every institution already reports, plus outcomes the government can measure directly, and let them sort and filter. A user can search by name, by program, by location, or by size, then line up schools side by side.
When it launched and who runs it
The tool went live on September 12, 2015, during the Obama administration, and the digital services team 18F built the first version. The Department of Education owns and operates it now. A major redesign in February 2022 reorganized the pages and brought back program-level detail, but the purpose has not changed: give students, families, and advisers a plain read on cost and results before anyone signs a loan.
What the numbers actually measure
Every institution page reports the same core fields, which is what makes comparison honest. The main ones are worth knowing before you read a single school.
- Net price: the average yearly cost after grants and scholarships are subtracted, broken out by family income band, not the published sticker price.
- Graduation and completion rates: the share of students who finish, with retention as a second signal for schools where many students leave after the first year.
- Median earnings: what former students earn years after entering, drawn from federal tax records for those who received federal aid.
- Student debt and typical monthly payment: the median amount graduates borrow and a modeled repayment figure, so a family can weigh debt against likely income.
- Repayment and default: how borrowers from a school are managing loans afterward.
- Field of study: earnings and debt at the level of individual programs, so nursing and philosophy at the same campus are not averaged together.
Where the data comes from
Three federal pipelines feed the tool. Institution characteristics such as enrollment, price, and completion come through the Integrated Postsecondary Education Data System, the survey every college in the federal aid programs must file. Loan and grant figures come from the National Student Loan Data System, the government's record of federal student aid. Earnings come from administrative tax records held by the Treasury, matched to former aid recipients and reported only in aggregate. Because the earnings and program-level debt figures are built from federal aid records, they describe students who received Title IV grants or loans rather than every graduate, a limit the documentation states plainly.
How to read it without being misled
Numbers this clean can still mislead a reader who takes them at face value, so a few cautions apply. Earnings vary with geography as much as with school quality, since a graduate working in a high-cost city will out-earn a classmate in a rural county doing similar work. Program mix matters: a campus heavy in engineering will post higher median earnings than one centered on social work, without either school being better at teaching. Small cohorts get suppressed to protect privacy, so a niche program may show blanks. And earnings are measured for aid recipients, which can skew results at schools where wealthier students pay cash and never enter the data. The right way to use the tool is comparative. Look at similar schools with similar programs, watch the direction of the gaps, and treat any single figure as one input rather than a verdict.
Open data and the API
The site is only the front door. Everything behind it is published as open data at collegescorecard.ed.gov/data, where researchers, journalists, and developers can download the full institution-level and field-of-study files or pull them through a public API. That is why the underlying numbers now show up inside third-party college-search sites, state dashboards, and academic studies. The Department releases documentation and a data dictionary alongside each update, so anyone rebuilding a metric can see exactly how it was defined. For a directory of education resources, that combination of a consumer tool and a documented open dataset is unusual and worth flagging: most college rankings hide their formulas, while this one hands you the raw material.
The practical audience is broad. High school counselors use it to talk families out of overpaying. Adult learners weigh a certificate against its likely payoff. Policy analysts track how a sector performs over time. In each case the value is the same: a shared, government-maintained baseline that describes what a college costs and what tends to happen after, in numbers that can be checked.
Who publishes it and how to reach them
College Scorecard is produced by the U.S. Department of Education, whose headquarters is the Lyndon Baines Johnson Building at 400 Maryland Avenue SW, Washington, District of Columbia 20202. The Department's public information line is +1 800-872-5327, also reached as 1-800-USA-LEARN, with a local Washington number of +1 202-401-2000. Filed under education, it is a reference-grade resource: a free, federally run way to compare institutions by cost and outcome, backed by open data that a curious reader can download and audit for themselves.



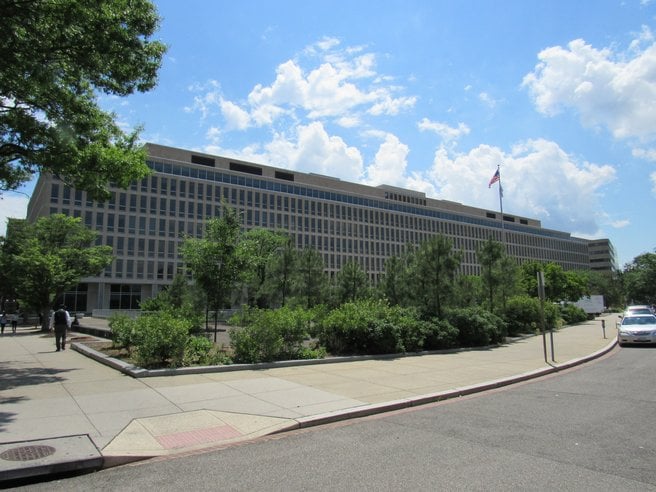

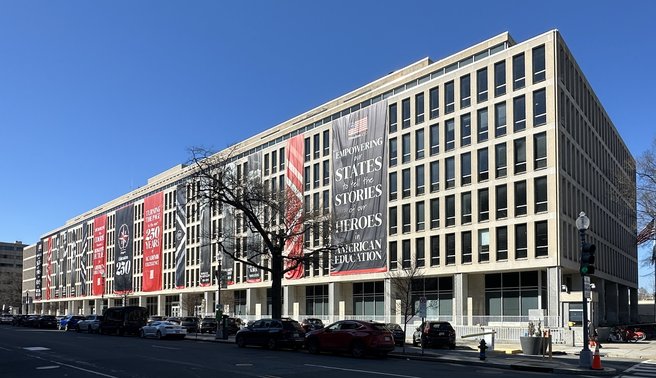
Business address
U.S. Department of Education
400 Maryland Avenue SW,
Washington,
District of Columbia
20202
United States
Contact details
Phone: +1 800-872-5327