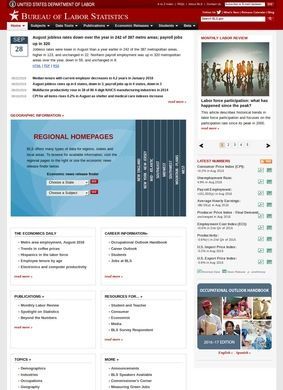
Nearly every headline number that moves markets and shapes policy debate in the United States starts here: the monthly jobs report, the Consumer Price Index, the unemployment rate. The U.S. Bureau of Labor Statistics produces those figures, and the U.S. Bureau of Labor Statistics puts the raw material behind them in public view. That combination is what makes bls.gov worth knowing rather than just citing in a footnote.
Inflation, pay, employment data
The subject coverage is wide and clearly divided. Inflation and prices gets its own cluster: the Consumer Price Index, Producer Price Indexes, Import and Export Price Indexes, and Contract Escalation guidance for anyone writing price adjustment into an agreement. Pay and benefits runs deep too, with the Employment Cost Index, Employer Costs for Employee Compensation, wage data broken out by occupation, earnings by demographic and industry, county-level wages, modeled wage estimates, and occupational requirements. If you want to know what a specific job pays in a specific place, the U.S. Bureau of Labor Statistics lays out the paths to that answer plainly.
Employment and unemployment are handled as separate tracks, which reflects how the data is actually gathered. Unemployment figures come at national, state, and local levels alongside research work. Employment stretches further, covering national through county detail, worker characteristics, an American Indian report, employment projections, the Job Openings and Labor Turnover Survey, Business Employment Dynamics, and workplace injury counts. Productivity gets both labor and total factor measures, an area the U.S. Bureau of Labor Statistics has tracked for decades. Spending and time use pulls in Consumer Expenditures and the American Time Use Survey, one of those datasets people rarely expect a labor agency to keep, a record of how Americans divide their days between work, sleep, chores, and leisure.
Interactive tools for data access
Usable, and by a fairly wide margin. The Data Tools section is where the U.S. Bureau of Labor Statistics separates itself from a site that merely posts PDF tables. There is a public Data API for developers who want to pull series straight into their own applications. For people working in a browser, Series Report, Top Picks, One Screen, Multi-Screen, and Maps offer graduated levels of control, from a quick lookup to a detailed custom query. Data Finder and Customized Tables extend that reach further still.
Then come the calculators, the friendliest entry point for a general reader. The CPI Inflation Calculator converts a dollar figure across years. The Injury and Illness Calculator, Pay Measure Comparison, Industry Productivity Viewer, and the Employment and Wages Data Viewer each answer a narrower question without demanding that anyone download anything. A COVID-19 Economic Trends section collects the pandemic-era indicators the U.S. Bureau of Labor Statistics assembled in one place. A student can use the same underlying numbers a professional economist queries through the API, just through a gentler door.
Geographic breakdowns round this out, organized around regional offices in Boston, New York, Philadelphia, Atlanta, Chicago, Dallas, Kansas City, and San Francisco. International and cross-region data sits alongside the domestic series, so comparisons across areas are built into how the U.S. Bureau of Labor Statistics presents its work instead of bolted on afterward.
Publications and career guidance
Publications give the numbers context and a human voice. The Economics Daily posts short, digestible items. Monthly Labor Review carries longer analytical pieces, and Beyond the Numbers and Spotlight on Statistics translate dense findings into something readable. Research papers are there for people who want the methodology behind a figure. Two publications deserve singling out. The Occupational Outlook Handbook is probably the single most consulted thing the U.S. Bureau of Labor Statistics produces, a career-by-career reference on what jobs involve, what they pay, and how demand is projected to shift. Career Outlook sits next to it with shorter, practical pieces aimed at people making decisions about work.
Audience-specific navigation paths
The audience segmentation is unusually explicit. Distinct paths are marked for Business Leaders, Consumers, Developers, Economists, Investors, Jobseekers, Media, Public Policymakers, Researchers, Students and Teachers, and Survey Respondents. A developer hunting API documentation and a teacher looking for classroom material want different things from the same institution, and the U.S. Bureau of Labor Statistics accepts that instead of funneling everyone through one generic front page. There are K-12 classroom resources, which turn national economic data into teaching material for grades where students would otherwise never touch a real dataset. A Release Calendar shows exactly when the next jobs report or CPI print lands, information that traders and journalists plan around to the minute.
An A-Z Index and a Glossary handle the reality that this field is thick with terms of art, and the Glossary in particular saves a newcomer from misreading a number because they assumed a word meant what it means in ordinary speech. For anyone who wants to understand the institution itself, sections on BLS history, leadership, and budget and performance are published openly, a level of self-disclosure the U.S. Bureau of Labor Statistics extends to itself that not every data provider bothers with.
What holds the whole thing together is consistency of method. Because the U.S. Bureau of Labor Statistics is the body actually running the surveys, the wage figure a jobseeker reads in the Occupational Outlook Handbook traces back to the same collection machinery a policymaker relies on. There is no second-hand aggregation, no repackaging of someone else's numbers. The source and the interpretation live under one roof.
All that scope has a downside too. With this many subject areas, tools, and publications, first-time visitors feel the size of it, and finding the exact series wanted sometimes takes a few clicks through One Screen or Data Finder. That is the honest cost of comprehensiveness, and the A-Z Index and Glossary exist to soften it. It is worth being clear about what this is not. The U.S. Bureau of Labor Statistics deals in aggregates and estimates, not real-time feeds or investment advice. Investors listed among the intended audiences get context and history, not a ticker. Read with that expectation, the depth is a strength; read expecting instant signals, a visitor will need to do their own work on top of what the U.S. Bureau of Labor Statistics provides.
The breadth of who it serves keeps paying off the longer you look. A researcher building a wage model, a reporter checking a claim before deadline, a high-school teacher assembling a lesson on inflation, and a person weighing a career change can each land on material shaped for them without stepping on one another. Few public resources are simultaneously this technical and this approachable, and the U.S. Bureau of Labor Statistics manages it by building parallel routes to the same trustworthy core.
How to use this resource
Students and teachers should treat this as a first stop, not a last resort: start with the Career Outlook articles and the K-12 classroom resources, then move a class into One Screen to pull a live wage or inflation figure and let students see where a headline number actually comes from. A jobseeker weighing options should open the Occupational Outlook Handbook entry for the role in question and check what it projects for demand in that field. Either way, save the Release Calendar so the next data drop never catches anyone by surprise.